Ever wish there were a way to take a snapshot of two proteins as they interact or remain unbound? Now, the door is open to study protein interplay and functional states while keeping the structural integrity of cells. Our latest innovation, Naveni™TriFlex Cell, uncovers protein complex formation and disassembly in response to different stimuli in situ. This revolutionary proximity-based technology concurrently visualizes two proteins in a free and complex state, within any cell compartment. Naveni™TriFlex Cell enables you to shed light on the hidden lives of proteins.


Naveni™TriFlex relies on two user-determined primary antibodies against the targets of interest, and on proprietary TriFlex Navenibodies (in orange), which are antibody-based proximity reagents. Only proteins located at <40 nm distance are recorded as interacting. Naveni™TriFlex detects total protein A (i.e., both free and in complex with B, yellow), total protein B (maroon), and the AB interaction (blue). The detected A, B and AB signals are amplified and generate fluorescent readout in three channels corresponding to each protein pool.
From the cradle to the grave
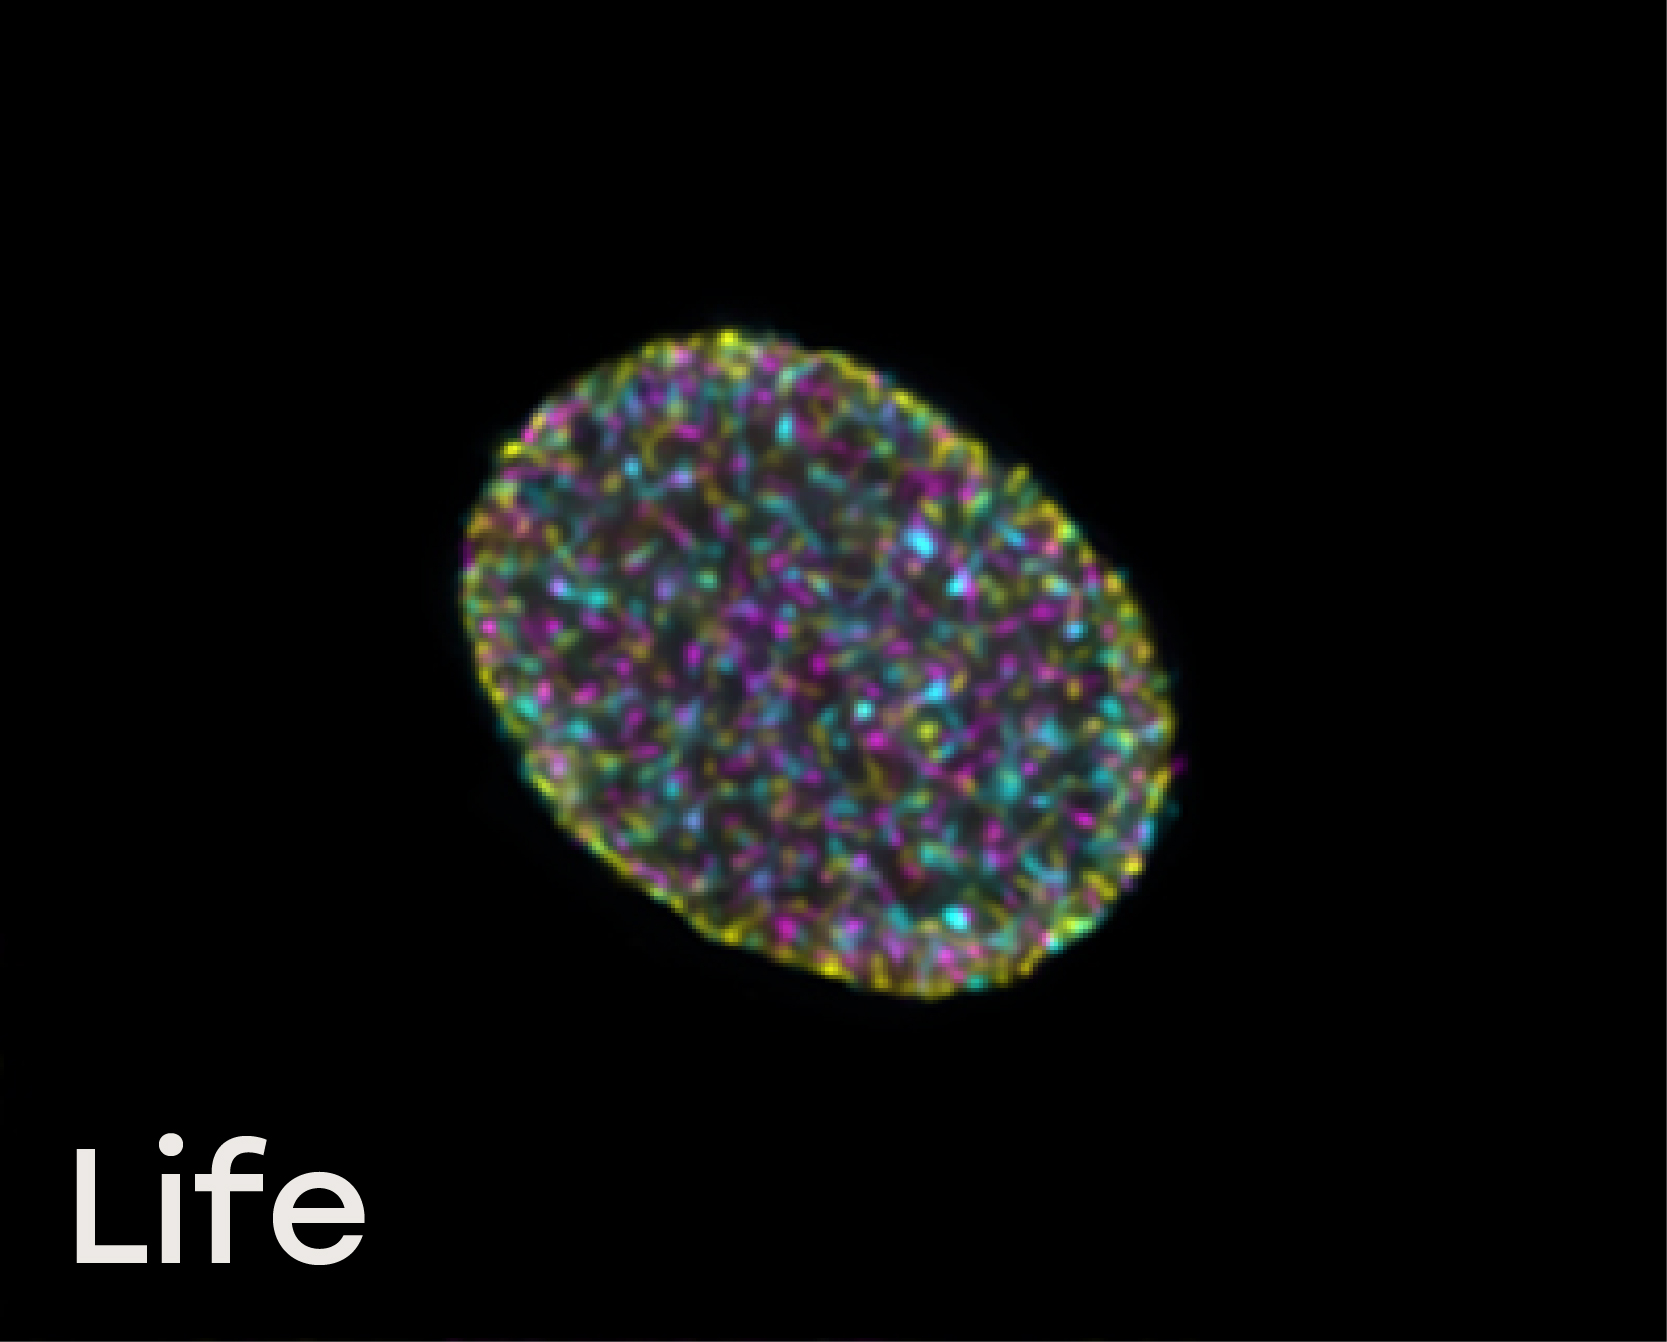
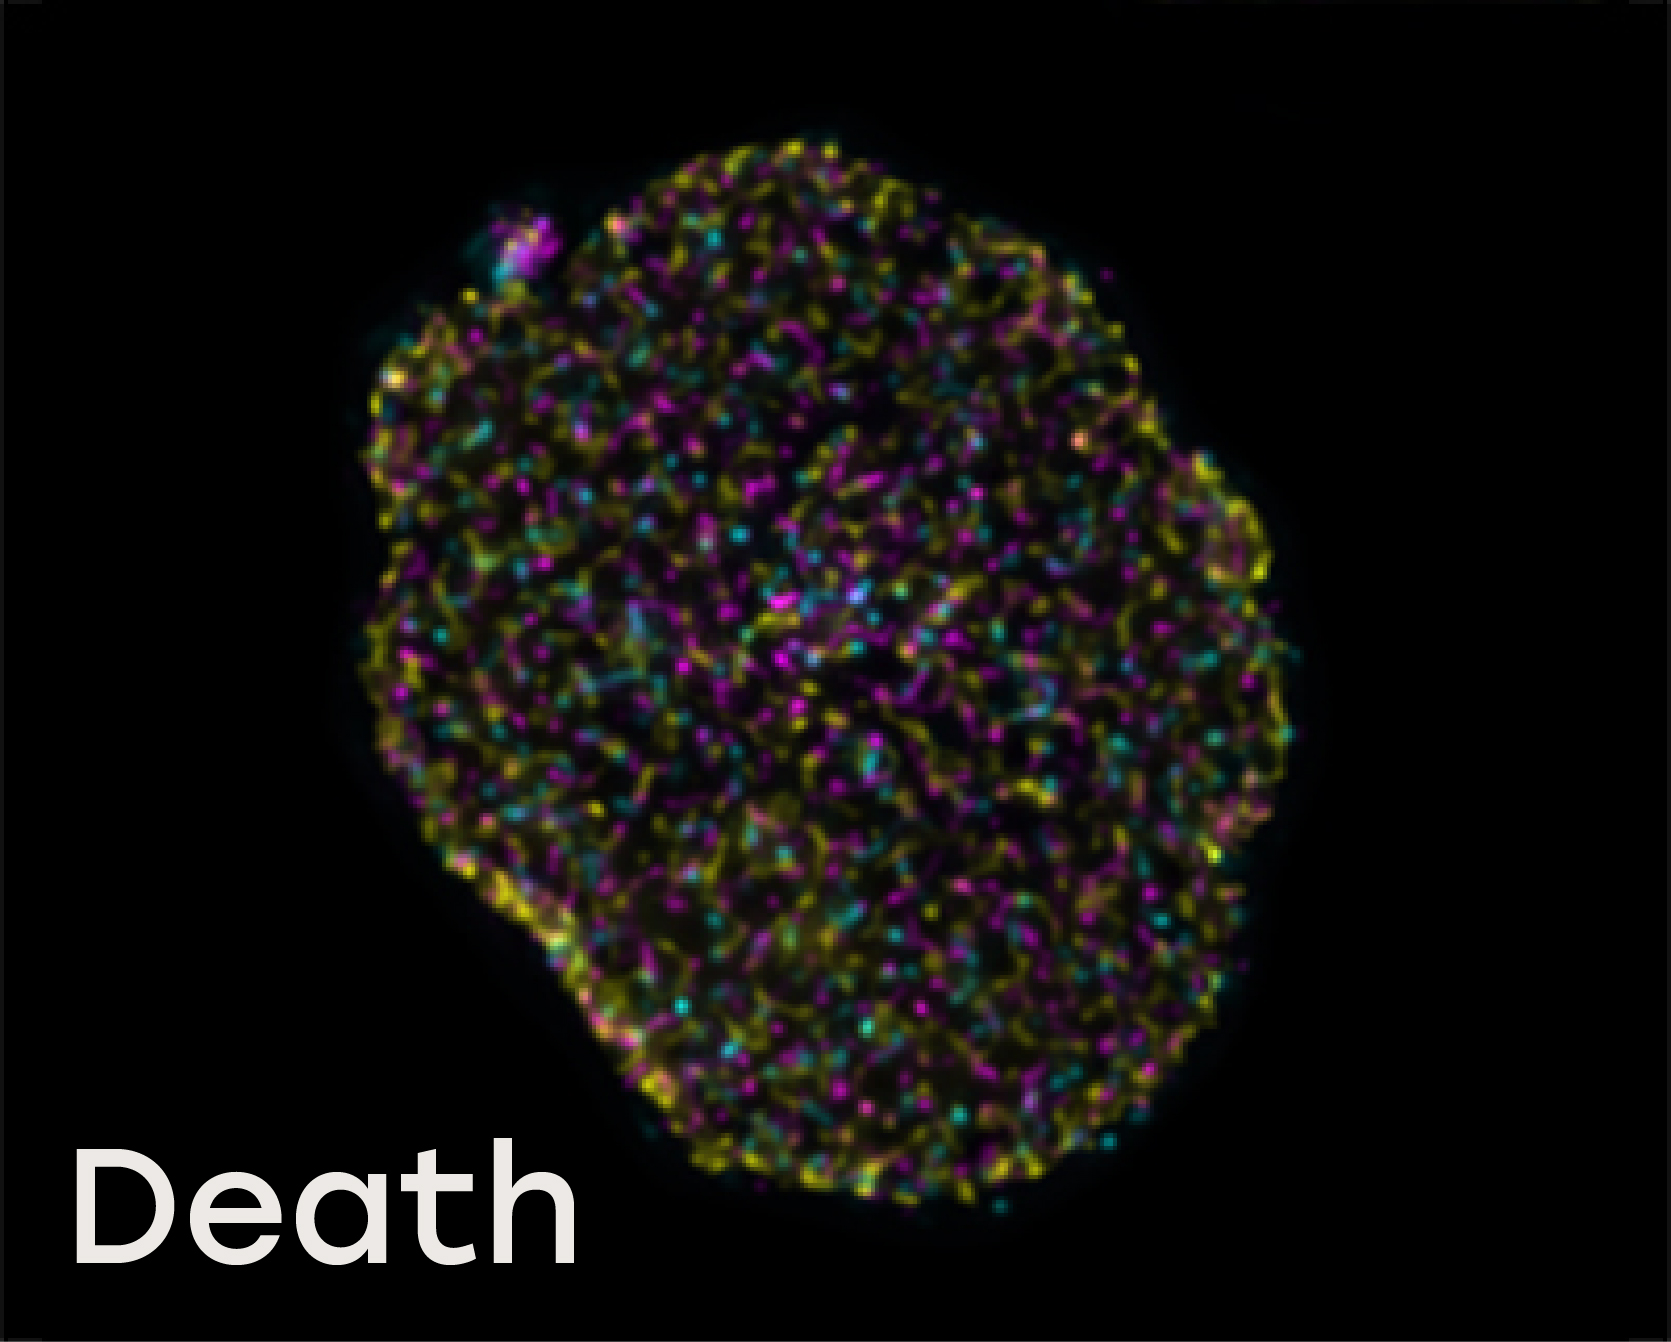
Naveni™TriFlex Cell was used to simultaneously detect free and interacting Lamin B1 and Histone H3
Birth: In mitotic cells, Lamin B signals (yellow) are diffuse due to nuclear envelope breakdown, whereas Histone H3 (magenta) remains around the metaphase plate. Lamin B/Histone H3 complexes (cyan) have disassembled.
Life: In non-dividing cells, free Lamin B is localized in the nuclear envelope, and multiple Lamin/Histone H3 interactions are observed in the nucleoplasm together with chromatin-bound Histone H3.
Death: During the initial stages of oncosis, the dying cell’s nucleus swells and the nucleoplasm contains less densely packed complexes along with unbound Lamin B and Histone H3.

Highly abundant proteins visualize cell-cell adhesion
Naveni™TriFlex Cell was used to detect the interaction of β-catenin/ E-cadherin, as well as total β-catenin and E-cadherin. Images depict what is seen in each of the three different channels, as well as a merged image. β -catenin and E-cadherin are highly expressed proteins and the interaction between the two proteins is important for cell-cell adhesion.

Total protein signal of Beta-catenin in MCF7 cells, signals visualized in FITC filter set (yellow)

Total protein signal of E-Cadherin in the same MCF7 cells, signals visualized in Cy3 filter set (magenta)

Beta-catenin/E-Cadherin interaction in the same MCF7 cells, signals visualized in Cy5 filter set (cyan)

Merge of the three filter sets, Beta-catenin signals in yellow and E-Cadherin signals in magenta. Beta-catenin/E-Cadherin interaction in cyan. Overlapping signal is white.
Overlap of fluorescent signals is not a synonym for protein interaction
What appears as an overlap of two fluorescent signals needs to be distinguished from protein-protein interaction. Learn how and why below.
Naveni™TriFlex Cell is used to simultaneously detect two proteins and their interaction based on Naveni™ Technology. The protein targets reside in separate cellular compartments and are not expected to interact. In line with this, the mitochondrial protein COX1 (FITC, in yellow) and the Golgi apparatus protein GM130 (Cy3, in magenta) are clearly detected in their respective compartments but no proximity signal is generated (Cy5, in cyan). Notably, the proteins appear to be present in the same physical structure in the cell – there is an overlap of fluorescence when channels are merged. In traditional immunofluorescence, this could falsely be interpreted as co-localization and interacting proteins.

Total protein signal of COX1 in MCF7 cells, signals visualized in FITC filter set (yellow), nuclei shown in blue.

Total protein signal of GM130 in the same MCF7 cells, signals visualized in Cy3 filter set (magenta), nuclei shown in blue.

Undetectable signals for COX1/GM130 interaction in the same MCF7 cells, signals visualized in Cy5 filter set (cyan), nuclei shown in blue.

Merge of the three filter sets, COX1 signals in yellow and GM130 signals in magenta. Where COX1 and GM130 signals overlap, the signal is white and could falsely be interpreted as interaction.
Description of the kit
The NaveniTMTriFlex Cell MR is an in situ kit, to be used with the user’s primary antibodies of choice (raised in mouse and rabbit). The kit enables fluorescent staining of protein-protein interactions, concurrently visualizing the two proteins in their free state. It is based on our proprietary Naveni Proximity technology
Included in the kit:
- Anti-mouse Navenibody
- Anti-rabbit Navenibody
- Detection fluorophores requiring filter sets for FITC (rabbit antibody signal), Cy3 (mouse antibody signal), Cy5 (proximity signal).
- Buffers for blocking and dilutions, and all detection reagents
- The Navenibody solution has a working volume of 4000µl (sufficient for approx. 100 reactions)
Navinci Technology
Learn how to maximize information from every analysis by localizing and quantifying proteins, their interactions, and modifications in situ at a molecular level. In situ methods are commonly used in the cancer research field, and studies of protein-protein interactions (PPI) and post-translational modifications (PTM) are essential for:
- In-depth understanding of basic biology
- Biomarker discovery
- Patient stratification
- Drug testing
- Treatment validation
All our products are based on our proprietary Naveni Proximity Ligation technology with dual antibody recognition giving you more specific and sensitive detection of your target of interest. Click here to read about the technology.
To our flexible products – to use with your primary antibodies
To our specific products – for the precise detection of PD1/PD-L1 interaction and phosphorylated PD1, Met, VEGFR2, EGFR, HER2, and PDGFR-beta.
Expert opinion:
’The TriFlex product makes it possible to measure protein co-location with high precision, independent of microscope resolution.’
This is what imaging expert Carolina Wählby, professor in quantitative microscopy at the Dept. of Information Technology and SciLifeLab, and main contributor to the development of image analysis software CellProfiler, had to say about our newest technology.